rnaends R package to study exact RNA ends at nucleotide resolution
The rnaends R package focuses on exact 5’-end and/or 3’-end quantification of RNAs via targeted RNA-Seq.
Features
- Pre-processing raw reads FASTQ file
Reads parsing and validation
Reads feature extraction
Demultiplexing into separate fastq files
- Quantification of 5’-end or 3’-end of mapped reads
Unique Molecule Identifiers (UMI) use for PCR duplicates elimination
Mapping: map_fastq wrapper for Bowtie or Subread with appropriate default parameters
Quantification: quantify_5prime or quantify_3prime functions
Applications
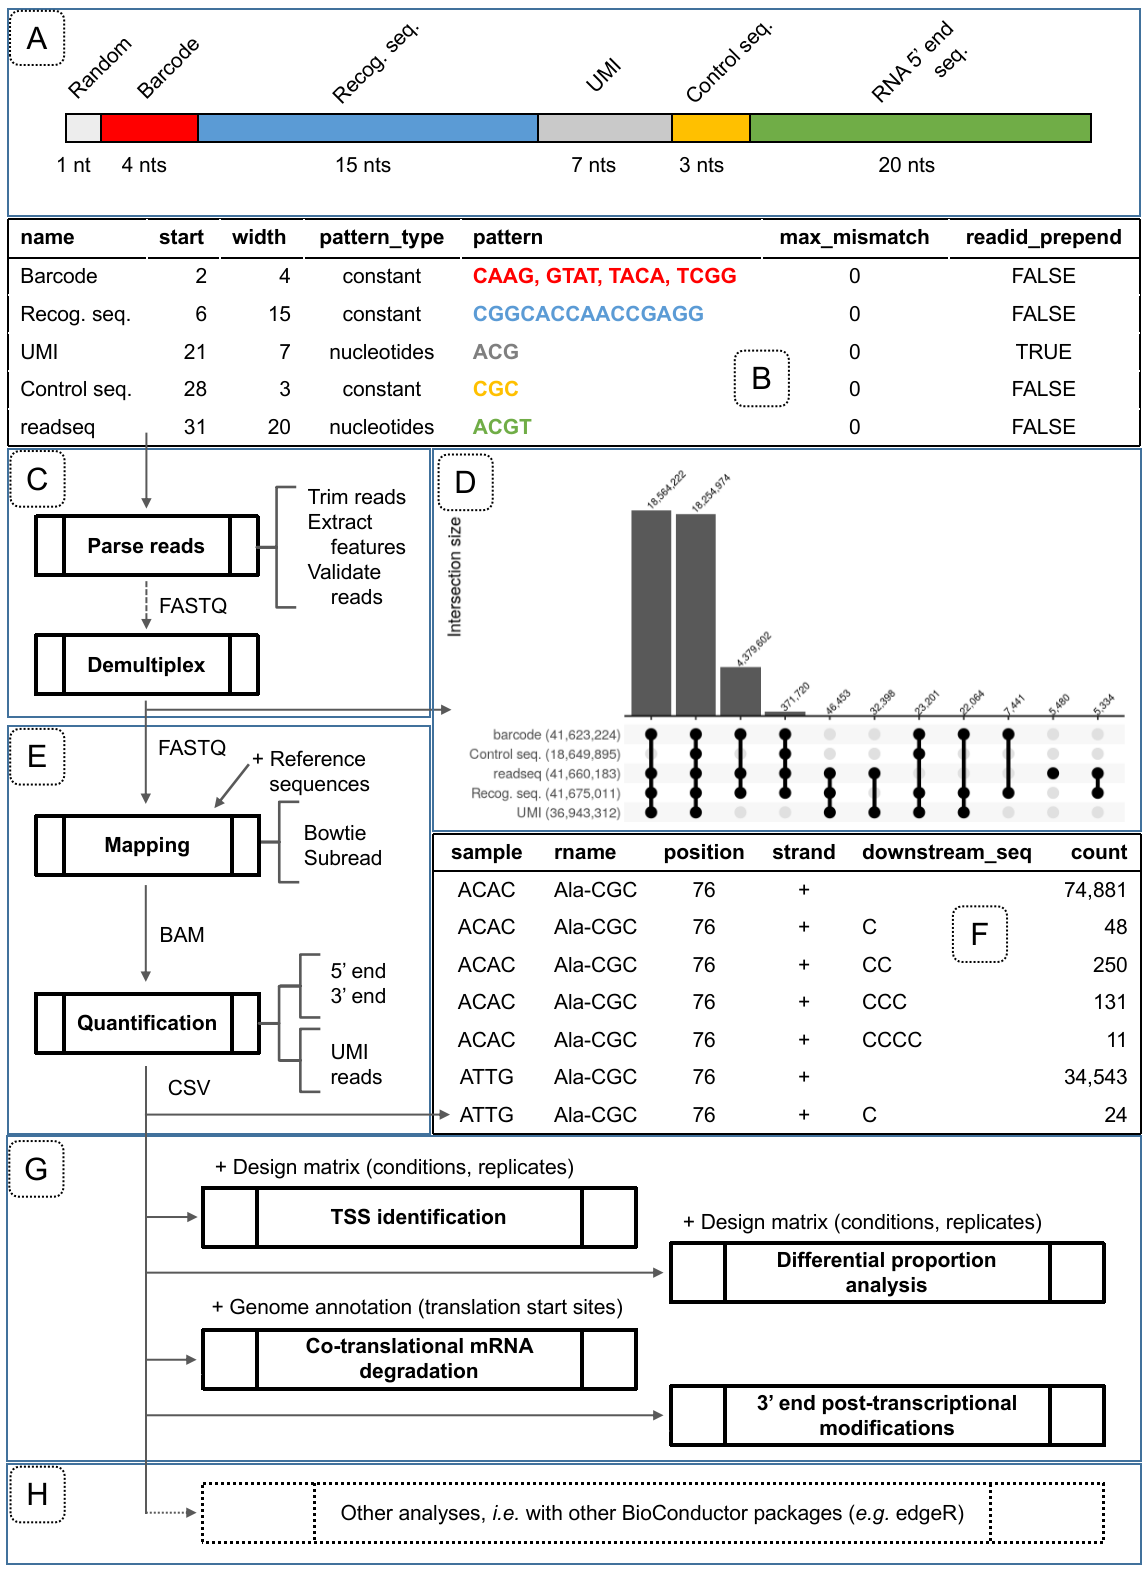
Figure 1: Overview of the features provided in the rnaends package grouped by phases of an RNA-end sequencing project. A) Overview of read structure: 1 random nucleotide, then the 4 nucleotides of barcode (here either CAAG, GTAT, TACA or TCGG) identifying 4 multiplexed samples, then the recognition sequence (CGGCACCAACCGAGG), then a UMI (7 random A, C or G nucleotides), then 3 nucleotides of control sequence (CGC), and eventually the actual 5’ end of the RNA (20 nucleotides) which can be mapped onto the reference sequence; B) read_features table obtained with the functions init_read_features and add_read_feature corresponding to the read structure in panel A; C) for FASTQ reads pre-processing and validation based on a read_features table describing the structure of sequencing reads; D) Distribution of read features validity described in panel A and represented by an upset plot generated after the parsing, validation and demultiplexing of a raw read FASTQ file. Each combination of valid features is displayed in the lower upset plot while the upper bar plot shows the corresponding number of reads; E) for aligning reads on reference sequences and compute abundances at the single nucleotide resolution to obtain F) a count table representing the abundances (count) of RNA 3’ or 5’ ends mapped to a reference sequence (rname) at a certain location (position) on a strand. In this example, the reads contain UMI extracted in the pre-processing step that are used at this step to remove PCR amplification duplicates introduced in the library preparation; G) rnaends provides functions for downstream analysis of the count table for TSS identification, analysis of RNA-ends species proportions (e.g. 5’P/5’PPP in WT vs. mutant strain), periodic signal analysis such as ribosome translation speed profiling, or the exploration of 3’ end modifications; H) rnaends count table can also be analyzed further by other libraries: we illustrate this by a differential expression analysis to identify endoribonucleolytic cleavage sites by comparing abundances between WT and endoRNase deletion mutant strains.
Vignettes
- Pre-processing functions (
parse_readsordemultiplex) of 5’/3’-ends RNA-Seq data - TSS identification using 5’-end RNA-Seq data
- Endonucleolytic cleavage site prediction using 5’-end RNA-Seq data
- Co-translational exoribonucleolytic degradation profiling in A. thaliana using 5’ end RNA-Seq data
- Co-translational exoribonucleolytic degradation profiling in S. aureus using 5’ end RNA-Seq data
- 3’-end post-transcriptional modifications exploration and differential proportion analysis
- Download dataset
- Pre-processing of reads prior mapping
- Demultiplex original raw FASTQ file(s) into separate FASTQ files
- Mapping of reads and quantification of 3’-ends abundances in a count table
- Convert bam files to count table with
quantify_3prime - Downstream analysis: 3’-end post-transciptional modifications exploration
- Visualize proportions of post-transcriptional modifications with bar plots
- Differential proportion analysis: which tRNAs are significantly modified by toxin?
Reference manual
- DESCRIPTION
add_read_featuredemultiplexdifferential_proportiondifferential_proportion2.parse_yield.trim_yieldFFT_profileFFTframe_preferenceinit_read_featuresload_bam_as_tibblemap_fastq_filesmap_fastqmap_stats_bam_filesmap_statsmetacounts_featuremetacounts_normalizedmetacounts_regionparse_readsplot.feature_metacountsplot.frame_preferenceplot.metacounts_periodicityprint.read_featuresquantify_3primequantify_5primequantify_downstreamquantify_from_bam_filesread_feature_pattern_typesreads_parse_report_ggupsetreads_parse_report_to_upsetr_expressionsummarise_alignementsTSS_betabinomialTSS
About